Trends You Can Trust: Beyond the Basics
Trends grab attention fast - ‘donations doubled,’ ‘sales spiked,' ‘engagement soared.’ But without knowing how to analyze them, you risk chasing noise.
In Part 1 (Trends You Can Trust: Foundations), we covered the basics: always label the time period, check the baseline, and watch for seasonality. Those steps build a solid foundation.
Part 2 goes deeper: time horizons to uncover hidden angles, compound growth to spot true momentum, and tackling trend disruptions. These are 3 ways to sharpen your analysis for decisions that matter.
1. Use Time Horizons Effectively
Choose the time period that fits your operations.
Which one depends on what you’re measuring, how quickly things change, and what’s realistic given your data and resources.
Key factors:
What you want to learn. Are you checking business performance, marketing campaign results, or generational shifts? Different goals need different windows.
Speed of change. Fast-moving industries (like e‑commerce) may need hourly data; slower fields (like library visits) might only need monthly or quarterly.
Data availability. If last week’s data isn’t ready until next month, weekly reports may not be useful.
Capacity. If you have only an hour for reporting each month, weekly analysis isn’t feasible unless automated.
Rules of thumb for choosing your trended time period:
Hourly/minute: Flash sales or social‑media launches
Weekly/monthly: Day‑to‑day operations (sales, support tickets, customer engagement)
Quarterly/yearly: Bigger shifts (economics, strategy, business performance)
Use more than one time frame.
Once you’ve set up your main trend time period for monitoring, zoom in or out for deeper analysis. Different time horizons highlight different aspects of a story.
Zooming out: Medium- and long-term views guide strategy. Take the stock market: daily charts highlight volatility, but years or decades reveal cycles and growth. Marketers, too, can track weekly email campaign performance while also evaluating the channel itself over quarters or years to judge overall effectiveness of email vs. social vs. print.
Zooming in: Short-term data sharpens tactical choices. Marketers examine email performance by the day or even hour to find the best send time. Investors might study daily market swings to fine-tune entries and exits.
The point: Each time period tells you something unique. Layering them together reveals patterns you’d likely miss otherwise.
2. The Power of Tiny Trends Over Time
The most important story often shows up over 5, 10, or 20 years. This is where compound growth matters.
In personal finance, compound growth means your money earns returns, and then those returns earn returns - like a snowball rolling downhill. Even small amounts grow large when invested over time.
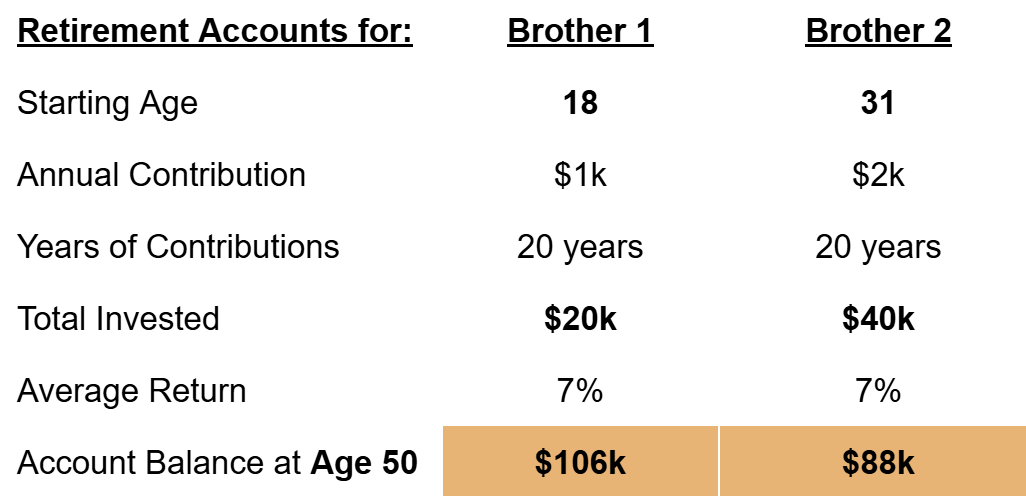
Compare the strategies of two brothers: Brother 1 begins saving $1,000 a year at age 18 and continues for 20 years. Brother 2 waits until age 31, then invests $2,000 a year for 20 years. By age 50, Brother 1 has grown his $20,000 investment to ~$106,000. Brother 2, despite investing $40,000, has only ~$88,000. Same returns, different timing. Starting earlier made all the difference.
Now flip to business. On his resume, a salesperson boasts growing his accounts 50% from $500K to $750K. Sounds impressive, right? Turns out he’s been in his job for 8 years. That’s about 5.2% average annual growth. If you’re seeking someone to drive double-digit annual growth, that record tells a different story.
The takeaway? Increases (and decreases) compound over time, and that’s often where the real story lives.
To calculate “Compound Annual Growth Rate” aka CAGR:
CAGR = ((Ending ÷ Beginning) ^ (1 ÷ Years)) – 1
Example using above salesperson’s numbers: $500K → $750K over 8 years would be ((750,000 ÷ 500,000) ^ (1 ÷ 8)) – 1 = 0.052, or 5.2%, average annual growth.
3. When Surprise Events Disrupt Trends
Seasonality doesn’t always play by the rules. Unexpected events can throw everything off:
COVID lockdowns = home office surged📈, shoe sales tanked📉- except for fuzzy slippers
Stanley Quenchers went viral = revenue skyrocketed 🚀
Taylor Swift’s Eras Tour hit town = local businesses soared 😍
These one-off spikes (or drops) don’t fit the usual seasonal playbook. Here’s how to handle them:
One-time or “100 year” events: Compare to a pre-disruption baseline. For instance, after COVID, many companies would use 2019 as the reference point because it was the “last normal year.”
Shifts that stick: Reset your baseline to reflect the new reality. Consider the meteoric rise of Stanley drinkware: profits jumped 10x in just 4 years. Even though demand for the Quencher has cooled, we’d bet that profit expectations remain closer to the new baseline.
Wrap It Up: Next-Level Trend Analysis Tools
Match your reporting time period to how fast things change and what you need to learn. Then zoom in or out to get a fuller view.
Use compound growth (CAGR) to see the real long-term pace of change, not just “headline” spikes.
When surprise events disrupt the usual pattern, choose your baseline according to whether it’s a one-off or lasting shift.
These tools separate lasting change from passing noise, making insights sharper, credible, and decision-ready.
You’ve got this.
Enjoyed this article?
Click the ❤️ below. This helps other readers find this content and lets us know what resonates.


Always love when you remind about actual formulas. ;-)