

The Opinions Behind Every Forecast
What a hundred financial forecasts taught me about numbers, trust, and the room where they get decided.


Forecasts are just opinions with math.
That’s the whole secret. Somewhere behind every “we’re projecting 12% growth“ is a person, or a room full of people, who made a set of educated guesses, ran them through a spreadsheet, and put a number on paper.
The math makes it look official. But underneath the formulas, it’s still an opinion about what the future holds.
When you internalize that, forecasting becomes much less intimidating. Now it’s something you can question, discuss, improve, and defend with confidence.
Too often, people talk about annual targets with a mix of frustration and resignation: “There’s no way we can hit those numbers.” “Management just pulled this out of thin air.”
But others talk about their annual goals differently. Not with blind confidence, but with the calm certainty of people who’ve pressure-tested the plan. That difference isn’t luck. It’s a set of habits you can learn.
By the end of this article, you’ll understand what separates a forecast people trust from a number they quietly roll their eyes at, and why this skill is worth your time.
This article is part of a series about the data and skills we use to estimate the future. [Start with the introduction here.]
What exactly is a forecast?
A forecast is an estimate of a future outcome based on analysis of available data, current conditions, assumptions, and domain knowledge.
Here, we’re focusing on financial forecasts - specifically, an annual revenue forecast. But the same principles apply elsewhere, even in your personal life, like planning your retirement savings or estimating how much you will spend on groceries next year.
Annual revenue forecasts tend to carry a lot of organizational weight. Once a company sets its revenue for the coming year, that number is then divided into goals across regions, product lines, and sales teams. It can influence budgets, hiring plans, investments, and bonus payouts.
In other words, it is rarely just a number.
The process matters as much as the number
One talented leader I worked with used to say that setting the next year’s revenue forecast was the most important thing he did. The final number became his division’s goal, tied directly to bonuses and long-term incentives.
But the conversations behind the forecast mattered just as much.
The back-and-forth with his leadership team helped him gather better information, challenge assumptions, and create a sense of shared ownership. Even when someone disagreed with the final target, they understood the thinking behind it, and started planning how to reach it before the year even started.
The forecast was also a negotiation with company leadership (his management). It needed to be ambitious enough to support the company’s goals, but not so unrealistic that the team stopped believing in it.
Missing that forecast would not only affect his credibility; it would damage how senior leadership viewed his entire team.
That is why a strong forecast does more than predict the future. It creates alignment around what the organization believes is possible and what must happen next.
Where to start: top-down or bottoms-up?
Most organizations lean on one of three approaches.
Top-down
A top-down forecast starts with the big picture.
You might take historical revenue, review past growth rates, consider market expectations, and project the trend forward.
This approach helps anchor the forecast in historical reality. It is useful for answering questions like:
How quickly have we grown before?
What would a reasonable growth rate look like?
How does this compare with the overall market?
Bottoms-up
A bottom-up forecast starts with the individual components that produce revenue. You make assumptions about each one, and build the total from the ground up.
For example:
Revenue = number of clients × average revenue per client
But each part may break down further by region, product line, client size, pricing level, renewal rate, or sales channel.
This approach forces you to name the specific levers you are counting on.
Where will new clients come from? Which products will grow? Will prices increase? How many customers are likely to leave?
Both
Many teams build both a top-down and a bottom-up forecast, and then compare the results.
This isn’t redundant because each serves a different purpose. A top-down forecast keeps you grounded in historical reality and the need to build in growth. A bottoms-up forecast forces you to name the specific levers you’re counting on to achieve the number.
In comparing the results, the gap can reveal overly optimistic assumptions, missing information, or opportunities the historical data does not yet reflect.
You should also decide how accurate the forecast needs to be. In some organizations, reaching 99% of the target is considered close enough. In others, missing by 1% can affect bonuses, hiring plans, or investor confidence.
The consequences of being wrong should shape how carefully you build and monitor the forecast.
Where AI fits, and where it doesn’t
AI can be a useful thought partner in this process. It can help you:
Surfacing patterns buried in your historical data
Compare multiple scenarios
Stress-test assumptions
Identify missing variables
What AI shouldn’t do is build the forecast for you.
The exercise of thinking it through, wrestling with the assumptions, deciding what you actually believe, and figuring out how you’d achieve the number, is the part that matters. You’re the one who will be held accountable for hitting the number, not the model. “The AI said so” is not a credible answer to “why did we miss the target?”
The same scrutiny applies to other people’s forecasts. Ask where the assumptions came from. If the model uses external data, such as inflation projections, market research, or industry growth estimates, trace them back to a source you trust.
What data you’ll need
Fair warning: in addition to data, annual revenue forecasts take real time. They require input from multiple people - not just for buy-in, but because each person sees a different piece of the picture. That means calendar time for discussion, plus hours spent gathering data and documenting assumptions so they can survive a conversation.
In terms of data, start with three categories of information:
Historical performance
Review past revenue at a useful level of detail. Look for:
Growth or decline over time
Seasonal patterns
Unusual spikes or dips
Differences by region, product, or customer group
Patterns that are becoming stronger or weaker
Historical data gives you a starting point, but the fact that something happened last year does not mean it will happen again.
Current conditions
Next, consider what could bend the historical trend up or down. That might include:
Market growth or contraction
Economic conditions
Competitive changes
Planned price increases
New regulations
Product launches
Major customer wins or losses
Acquisitions or organizational changes
This is where context becomes essential. People close to the work can help determine how much these conditions could impact the forecast.
The underlying variables
For a bottoms-up forecast, identify the variables that drive the total.
For example:
Revenue = clients × average revenue per client
If these groups have a lot of variation within each, you may then consider segmenting them further like in the below.
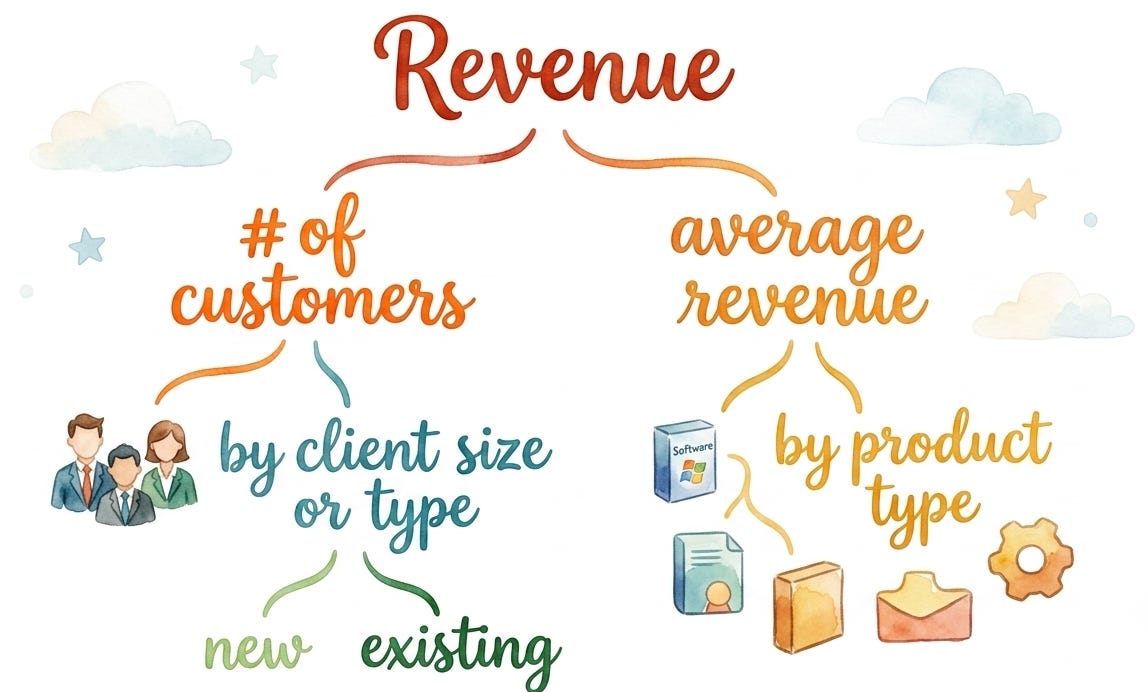
created with gemini With multiple variables, you can test the sensitivity of the model to see which is most influential. A 1% change in one variable may barely affect the total. A 1% change in another may dramatically change the result.
The variables with the greatest impact deserve the most scrutiny.
Make your assumptions visible
Every forecast rests on assumptions. Will last year’s growth rate continue? Will customers accept a price increase? Will the product launch happen on schedule?
Write those assumptions down. Make them visible. An assumption nobody can see is an assumption nobody can challenge, and an unchallenged assumption is often where forecasts go wrong.
Visible assumptions also make the forecast easier to update. When the conditions change, you can revise the relevant assumption instead of rebuilding the entire model or arguing about why the final number moved.
Assumptions worth pressure-testing
Whether you’re building the forecast or reading someone else’s, pay close attention to these assumptions.
Trends. What’s shifting in the market? What forces might push against that pattern continuing?
Clients. Is growth expected to come from new clients, existing ones, or both? How realistic are the client acquisition and retention assumptions?
Pricing and average revenue. Will prices increase? What are the average revenue assumptions per client or per product?
Products. Which products are launching or being discontinued? How quickly are customers expected to adopt something new?
Attrition and cancellation. What is the attrition rate? Which customers might leave, reduce spending, or delay renewal? Growth assumptions often receive more attention than the losses working against them.
Planned changes. Are you counting on a major sponsorship, acquisition/merger, new sales channel, or other one time event?
Contingency. This is the assumption people most often forget. No forecast survives reality perfectly intact. Build in room for uncertainty: the client who unexpectedly cancels, the launch that slips a quarter, the market shift nobody modeled. This makes your forecast more realistic. A forecast with no room for life to happen isn’t more accurate, just more fragile.
Why forecasting is worth learning
Sometimes you’re handed a forecast. Sometimes you’re the one building it.
Either way, your ability to read, question, and explain it affects whether you can paint a credible picture of what’s possible over the next year.
Get it wrong, and the costs are real.
A fantasy-driven target costs a leader credibility twice over: their team sees through it and quietly concludes they’re out of touch, and their own management watches them miss it and starts to question their judgment.
A technically correct model is not enough either. Perfectly sourced data and a mathematically sound model can still fail if nobody understands the realities behind the number. The real job is making assumptions visible and being ready to talk about them out loud, in a room, with people who will push back.
Learning to work with forecasts pays off in several ways:
It turns a vague hope for “a good year” into a concrete plan.
It builds alignment around how the organization will get there.
It reveals which actions and variables matter most.
It creates space to test new approaches and experiment.
It helps leaders make better choices about money, people, and time.
Bottom line
Forecasting is also one of the most transferable data literacy skills. When you learn to question data, structure assumptions, weigh evidence, and make a believable case for the future, you move beyond simply reporting numbers.
You become someone people trust to interpret what the numbers mean and help decide what to do next. That difference often determines who gets invited into planning conversations and who gets trusted with greater responsibility.
Next up in the series: how to build a business case that withstands scrutiny and makes a credible case for why your product, project, or business is worth the investment.