

How We Unlocked Our Substack Performance Data
When dashboards no longer answered our questions, we extracted the data and built our own system to analyze our data and to monitor our performance. Here’s how you can do it too.


We have a lot of new subscribers here this week. Welcome! We are glad you are here. This is a longer post than normal because we detail how we are extracting our Substack data for analysis, where we use AI and where we don’t (and why).
For those of you not on Substack, while the example is focused on a specific platform, the general ideas and findings are similar to what we see when looking at data coming from other platforms like Google Analytics, Shopify, etc. We are in learning mode, so if you have any suggestions on tools or things that worked well, we’d love to hear them!
- Rachel
Leveraging data to accelerate results. That’s what we help managers and entrepreneurs do - by using a disciplined approach defining objectives, selecting supporting metrics, evaluating data inputs, and making sense of the outputs. As we build our company, we turn that tough-love advice on ourselves, especially when it comes to our Substack newsletter.
So this week, we share how we’re handling Substack performance data. While it’s a workable model specific for our Substack goals, it is also adaptable for other creators’ goals.
Initially, we used Substack’s native dashboards. While they’re helpful, we soon found that they didn’t fully answer the questions we care about. So we built a more hands-on process, focused on understanding what drives success for us.
In this post, we will:
Explain how we use Substack data and where we ran into limits.
Argue why you should look at the data itself and why AI alone is not enough.
Detail the steps we followed to unlock our Substack data and what we learned.
Substack metrics we care about (right now)
We identified early on what we were not trying to do: we weren’t focused on paid subscribers or trying to maximize every possible metric.
We focused on building the right audience for us, and understanding what content was resonating. That’s what supports our larger goal, which is helping managers and entrepreneurs build a data feedback loop into their everyday work to accelerate their success.
Along the way, we refined our core metrics to a targeted set:
Relevant audience growth: subscribers and followers, across Substack and LinkedIn.
Content engagement, such as shares, restacks, and comments
Community building: interactions, connections and participation
But all of these metrics are not easily viewed over time and analyzed in the Substack dashboards.
How we use these metrics
We are leveraging the data in two key ways:
Ongoing monitoring. We review our target metrics regularly - usually weekly, some monthly - alongside what we actually did in that time period.
Analysis. We also wanted to compare different types of posts, notes and other activities. But we needed the data to support looking for patterns between effort and response.
Getting closer to the data
To achieve this, dashboard summaries or just feeding it into AI for analysis were not enough. We needed access to the underlying data so we could explore it directly and see what was being captured (and what wasn’t).

We wanted to build our own understanding of what is happening rather than rely on the conclusions coming from dashboards and AI.
These were good instincts because the dashboards didn’t tell the whole story, and the AI made assumptions and had incomplete conclusions.
So we set up a process and supporting system to extract, store, and explore our Substack data outside the platform.
Here’s how we did it - the quick version
Here’s the overview of what we did. If you want more detail, we have you covered. There is a step-by-step guide on how to do it yourself at the end of this post.
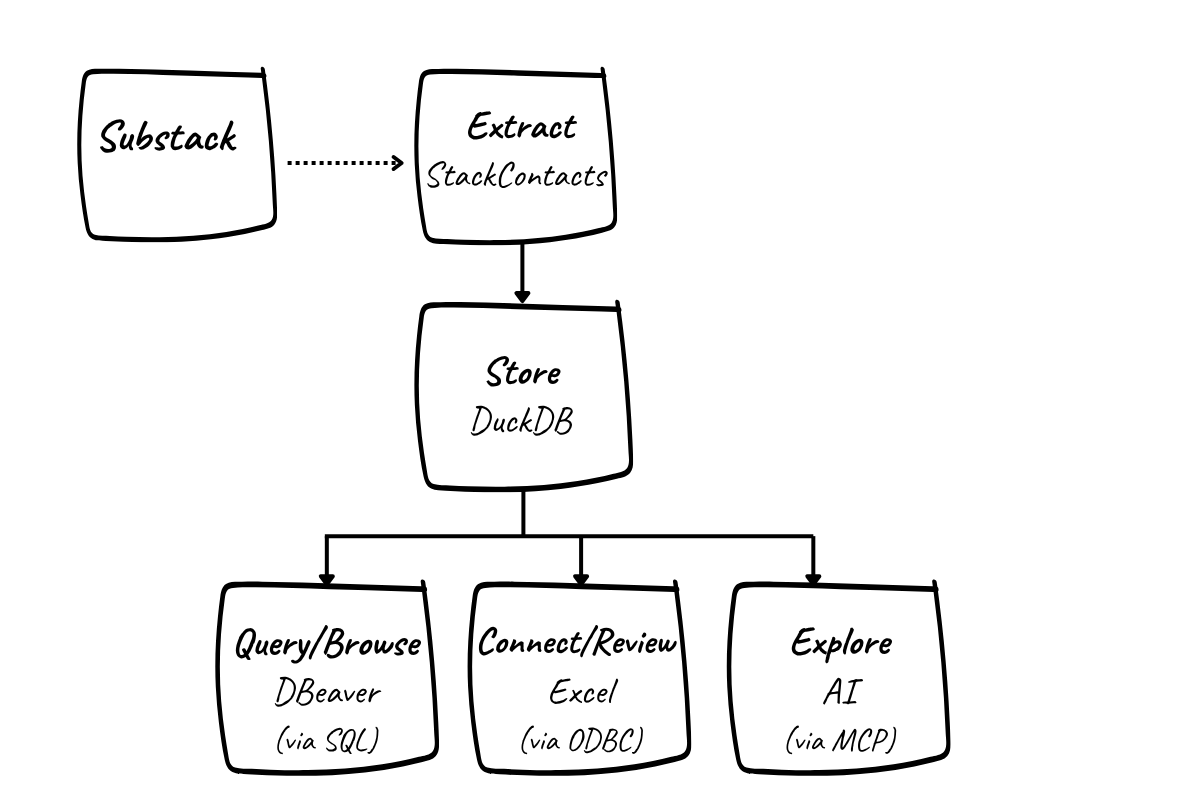
Extract the data
We use StackContacts (from Finn Tropy ) to pull Substack data, including subscribers, posts, and engagement, into a local database. This saves us from building API integrations ourselves and gives us access to more than what’s visible in the Substack dashboards. Once configured, the data syncs from Substack to a database, and can be automated to run regularly.
Store the data
The data is stored in a local DuckDB database. That means we own it and can query it directly. We aren’t dependent on a platform interface, and we can preserve our history.
Query the data
We created a handful of SQL queries to pull the data related to our key Substack metrics, such as audience growth and content engagement. As we learn more about the data, we refine the queries.
Connect the data to Excel
Our queries are embedded in an Excel file that we refresh weekly after syncing the data via StackContacts. We used an ODBC connection to directly tap the database from inside Excel.
Use the data to monitor progress and build a feedback loop
The Excel file gives us a consistent view of our key metrics over time, alongside what we actually did that week. It supports a simple, repeatable, review process with familiar tools and a critical subset of our data. Now that this is set up, it takes us only a minute to refresh the data.
Explore the data using AI
Of course, we’re also experimenting with AI tools to analyze the data. This can be helpful for generating queries and surfacing patterns - but only once we have a solid understanding of the underlying data. In our case, the Claude desktop app is accessing the DuckDB database via Model Context Protocol (MCP). This configuration is part of StackContact’s installation process.
Overall, this setup isn’t particularly complex once broken down into its parts, and it gives us something we didn’t have before: direct access to our own data, and the ability to shape how we measure and interpret it.
Want more details? A deeper dive is at the end of this article.
Why we collect more than we need right now
Even though we focus on a small set of metrics, we’re intentionally collecting more data than we actively use. Our early-stage history is valuable - and we don’t know yet what we might want later. Patterns that don’t matter now might matter at scale. Older behavior might become useful for comparison. Additionally, platform definitions can change; we’ve already seen shifts in how metrics like open rates are reported on Substack.
Keeping more complete data now gives us flexibility later.
Why the data was harder than expected
Once we had the data, we ran into something we often experience with clients: the Substack data itself was not cleanly organized.
There were many tables, with many fields, but no data dictionary with definitions.
Some fields looked similar, but meant different things.
Other fields were empty or inconsistently populated.
Mapping fields back to actual Substack activity took work, and several iterations.
In other words, the data didn’t immediately tell a clear story “out of the box.” We had to look at the actual data to get familiar with it - what the fields meant, which similar sounding field was the right one, how tables related to each other, and what was actually reliable.
For example, we track subscribers and followers weekly. We have been doing this manually, and wanted to pull richer data from Substack in a more automated way. So we developed a SQL query via the AI and produced a tidy data output - except for one problem. It said our followers went back to 2021, which isn’t possible. The issue? The field used in the query was the date our followers created their Substack profiles, not the date they began following us.
These structural issues and lack of data definitions are important to know when considering how you apply AI to analyzing your data.
Where AI helped and where it didn’t
Part of our setup allows AI tools to query and analyze the data. It would be tempting to leave it to AI to learn the structure and quirks of the data itself, but in practice, this can (and did!) backfire.
The detailed data is where you learn what your dashboard really summarizes and when to question the overly confident responses AI gives you.
The first question we tested with the AI was subscriber count. The resulting total subscribers was correct, but all free subscribers were labeled as “unsubscribed.” That was a fundamental misunderstanding of the data - and if that is wrong, everything built on top of it is wrong.
We had given the AI little context or instruction, and it was easy enough to prompt for correction. But even after iterating and guiding the AI through the database, there were still issues.
But if you operate with caution, the AI does bring real value. It helped:
Explore the data structure: it reliably identified which tables could be safely ignored for our purposes, and teased out relationships much faster than we could have. It was also significantly faster in working through the many fields looking for relevant data. Even when there were errors, the second review generally picked up the right field.
Generate queries: You don’t really need to know SQL (though a little bit always helps so you know what your query is doing). Rapid development and editing of queries saved hours. We know our strengths, and SQL syntax is not one of them.
Quickly surface key insights: Simple quick analysis, such as top performing posts by a variety of measures, tended to be reliable. We also tried out topical analysis, having the AI classify our posts and break down performance by theme. The groupings were very close to how we think about our content, which gave us confidence in the approach. More importantly, it highlighted both areas of strength and gaps where we may want to develop new content.
Going forward, given that we now better understand the detailed data, we will continue to use that knowledge to prompt AI to generate additional queries as well as be an analysis partner. We may also use it to run data quality checks when we update and refresh the data.
Summary: what this gives us
This process gives us a more useful set of numbers and a way to work with our data more deliberately.
We’ve chosen a small set of metrics to guide decisions, while keeping a broader record so we can learn over time. We’ve built a simple process we can repeat, refine, and actually use. And we’ve tested where AI can help - and where it can quietly lead us in the wrong direction if we don’t understand the data ourselves.
This is what it looks like, in practice, to build a data feedback loop: define what matters, get close to the data, and use it to inform what you do next.
If you’re interested in how this is set up in more detail, we’ve outlined the technical setup below.
Step-by-step guide: How to do this yourself
We’ll walk step-by-step through the setup. Note that we’re operating on PCs, not Macs. So while you can do all of this on a Mac, it’s going to look different.
In addition, the install manual for StackContacts is extensive, and we will not repeat all of that detail - but it may help you to see some of the setup screens and understand where things went right and wrong for us.
Step 1: Extract your data
Purchase StackContacts.
Obtain Finn Tropy’s StackContacts. Note that there are a number of editions to fit your environment: we have just one publication (Practical Data Foundations) and do not need the Gumroad or Kit integrations, so we bought the Hobbyist edition.
Note, this part of the process took us a little while, so set aside a few hours (and possibly more) to do this.
Review the install manual and complete prerequisite installations.
Read the install manual! It’s long. It’s dense. But very helpful. There are prerequisites before you can install StackContacts itself, including Node.js, npm, and the MCPB CLI tool. You need to know how to open a command prompt or PowerShell, and how to run those as an administrator. (Don’t know how? Do a search - AI results and lots of helpful shortcuts will pop up). In addition, you’ll need to install either the Claude desktop app or Cursor AI app (we used Claude).
Install StackContacts
The install manual will direct you to the product page for the latest installer. Run the installer, follow the prompts and then launch StackContacts. Be patient - it took a couple of minutes for our initial launch of the software.
If you run into difficulty: in our case, the Visual Studio install was accidentally interrupted at some point, which led to failures later in the install process. We went back and installed Visual Studio again, manually. Worst case? Uninstall, then start over.
Setup StackContacts with publication and cookie info
Follow the install guide to set up your publication. First, you’ll need to tell StackContacts how to communicate with your Substack publication. Using that login, a cookie is pulled from a specific Substack page, establishing the connection between StackContacts and your Substack stats.
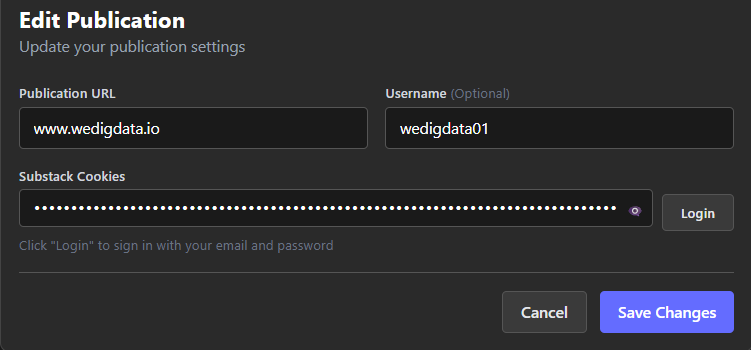
When you click Login, the app will give you the following window:
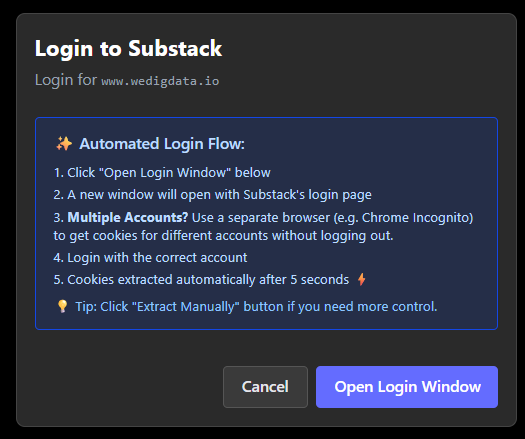
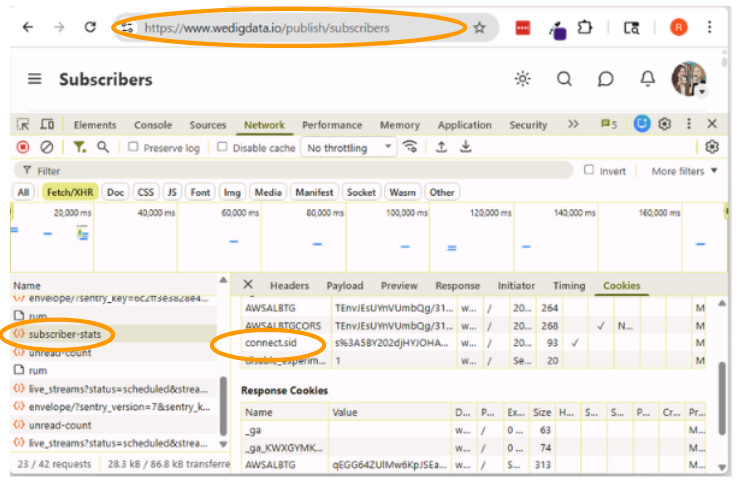
The automated process described in the manual and what the app defaults to did not work for us, producing login errors. We had to manually pull the cookie values. It’s described in the manual, but here’s what it looks like in Chrome.
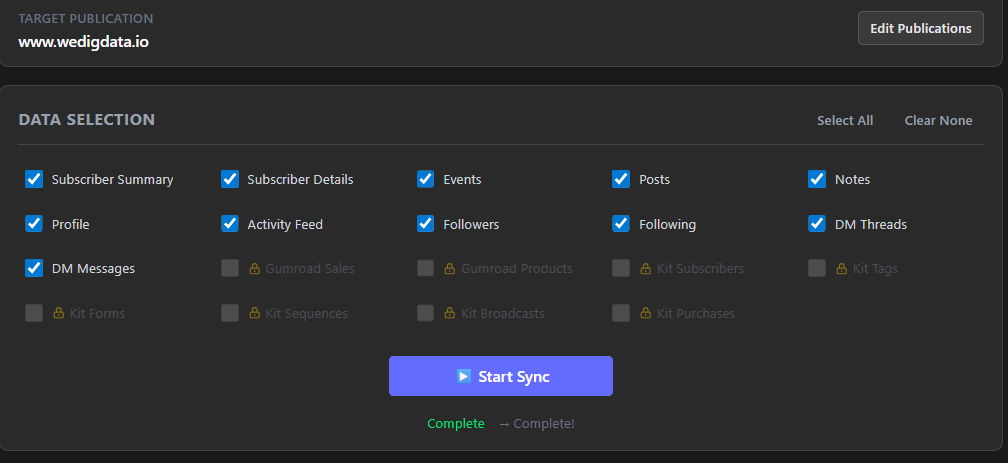
Sync your data
Once login was set up, the sync process itself was smooth. We’re pulling every possible metric we can from Substack. Our syncs are taking about 30 minutes, so be aware that if you have a lot of data or multiple sites, this may take a while. Our install is running on one local PC; the app is not kept running all the time so we’re not using the automatic syncing (it will fire only when the app is open and your PC is “awake”), but you can set up a date and time for an automatic sync.
Tip: When you sync, you are pulling all available data. What you had in the database before is overwritten - you’re not just appending data that’s new since last time. This has implications; notably that if you want to preserve history as it was, you’ll need to periodically back up your database. For example, say Substack stops making data on DM threads available. If you allow the database to be overwritten, you will lose that particular historical data.
Finish AI integrations
From here, you finalize the install by configuring either Claude or Cursor AI to enable AI-powered insights atop the data. For Claude, this meant creating and enabling the appropriate extensions. This process was smooth, aligning with the instructions in the manual.
A step we recommend: once you have completed the actual install, open Claude and instruct it how to find the database. Our initial prompts (e.g. show me my last 10 subscribers) were not successful because Claude had no idea what we were talking about. StackContacts is a “deferred” tool - meaning it didn’t load automatically. Claude could only find it after being told the name, triggering a tool_search to load it. So use a prompt like: “Use tool_search to find any connected database tools, then connect and show me what’s available.”
Step 2: Store your data
As part of the StackContacts setup, you will also set up DuckDB, an open-source SQL database. When Substack data is synced down to your local computer, this is where it will be piped. The database is not proprietary to StackContacts. This is positive because we can’t get locked out of our data even if we uninstall StackContacts. We own it, we manage it, we back it up. And even if you’re a large organization or scaling up, you can operate nicely for quite a while with DuckDB, whether locally or in the cloud.
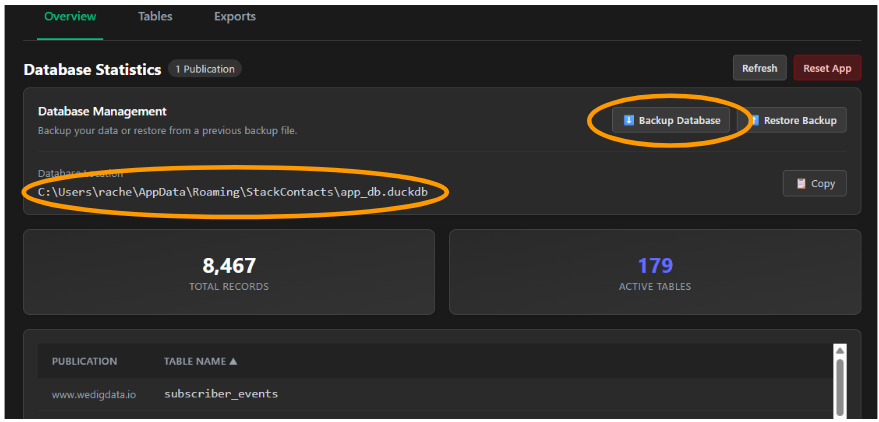
StackContacts’ data screen gives you quick access to database information and tools, including backup and restore of your database, a summary of records and tables, and a list of all tables from your publication.
Take note of the Database Location (circled) - you’ll need that if you choose to connect to it from Excel.
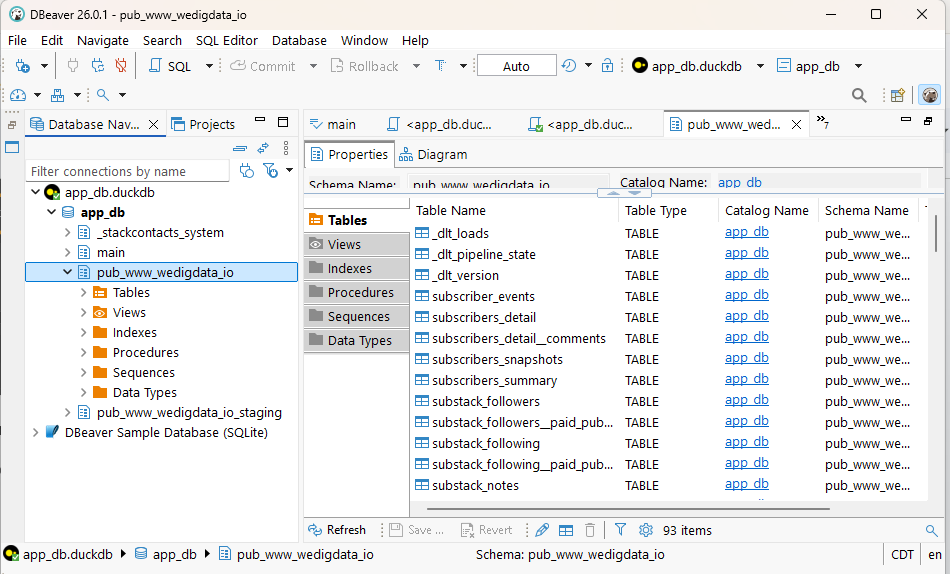
Want to see your data up close and personal?
Download a tool to browse it. We are using DBeaver - a free, open-source tool for database management. From here you can browse through the database structure, view the actual data, write and run queries and export data.
Step 3: Query your data
One of the things we learned in testing the AI integration was that the data structure and definitions were sufficiently complex that Claude could not do analysis without more significant familiarity on our part with the data to instruct it well. We knew we wanted the underlying data, but those experiments with Claude made it clear that we needed it.
So the next step was to set up standard queries for metrics we wanted to follow regularly. And just like we wanted to avoid writing any API calls, we also wanted to avoid writing the SQL queries - this author is great at defining the logic, but self-admittedly, terrible at syntax. This was a perfect use of Claude.
We started with a set of 6 queries that addressed our key needs: post and notes performance, top content by a variety of measures (engagement, subscriptions, shares), subscription activity over time and by source and a rolling summary of all engagement. (Interested in the queries? Send us a DM). We saved the queries in DuckDB (where they were originally tested), documented them in a text file, and began to build an Excel file that could be refreshed weekly after syncing the data.
(Wondering if you can do this with Google Sheets? There are ways, but they’re clunky - the big constraint is that your DuckDB database is local. If you move it to the cloud the path is easier).
Some tips:
StackContacts and DBeaver want exclusive access to the database while they’re running. So if you would like to run both at the same time, you will need to have DBeaver work in read-only mode.
Have one place where you keep your master copy of your SQL queries. You can modify them in DuckDB, in text, and in Excel - and it’s easy to lose track of which is the master. Just choose one, and remember to always update that documentation.
Because we are still refining our queries, we test them in DBeaver, keep a backup in a master text file and copy them into Excel. You’ll see how that works below.
Step 4: Connect the data to Excel
We have long used Excel to manipulate and analyze data. In order to be able to run queries from inside Excel, we had to do a couple of one-time setup tasks that enable the connection:
Download and install the DuckDB ODBC driver from duckdb.org (free)
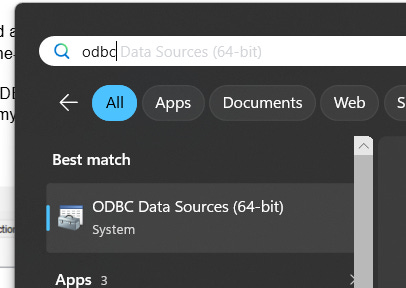
Configure the ODBC connection on my computer.
To set up the ODBC connection, click on the Windows key on your keyboard or click the Windows key + S to search. Type in odbc and select ODBC Data Sources (64-bit)
Click on the SystemDNS, then click Add.
Choose the DuckDB Driver, then click Finish.
Type in a Data Source name and the path to your database
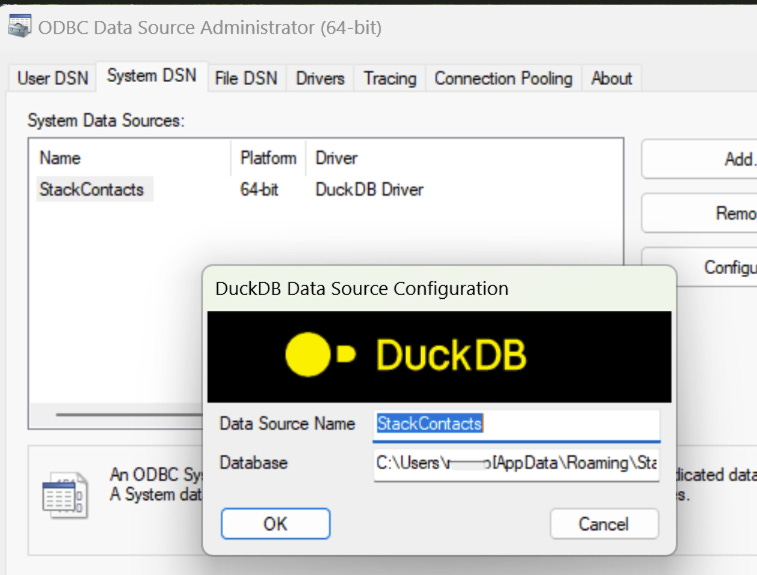
Now you’re ready to make the final link between Excel and your data.
Connecting to your database from Excel
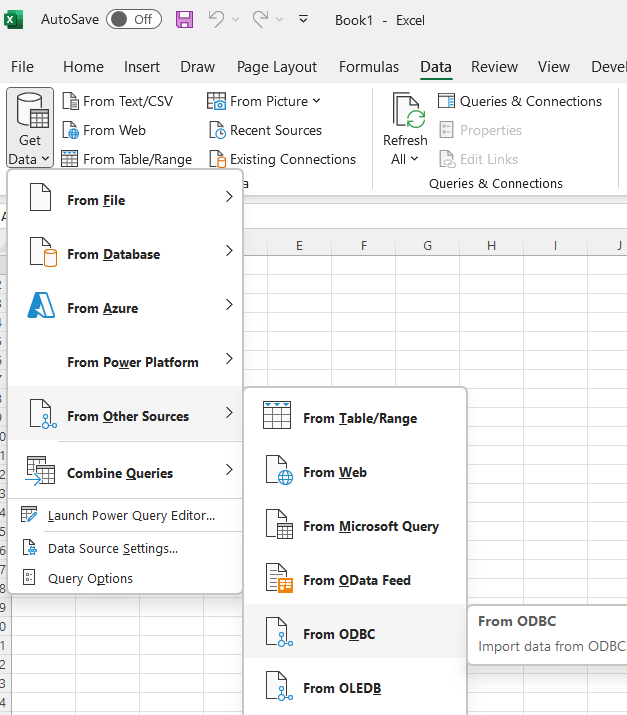
Open an Excel spreadsheet. From the Data tab, click Get Data | From other sources | From ODBC and select the StackContacts data source.
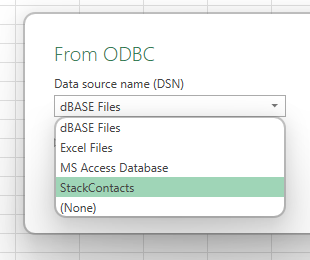
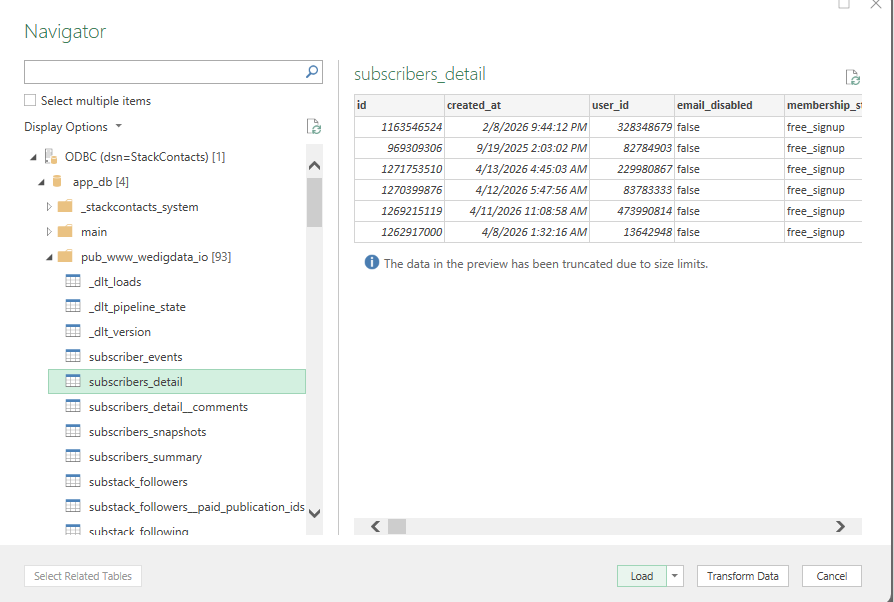
When you select StackContacts from this list, you can either click on Advanced and paste in a query. Or click OK to navigate the tables, preview and load the data into a worksheet.
Once you establish the connection, there are a number of different ways to explore the data in Excel. Because we had already written our SQL queries, we went to a blank worksheet, connected to the database (following the steps above), pasted in a query and loaded the data in the tab. We did those steps for 6 metrics-focused queries plus one to remind us when the data had been synced.
You can view, edit and refresh all your queries by clicking Queries & Connections from the Data tab.
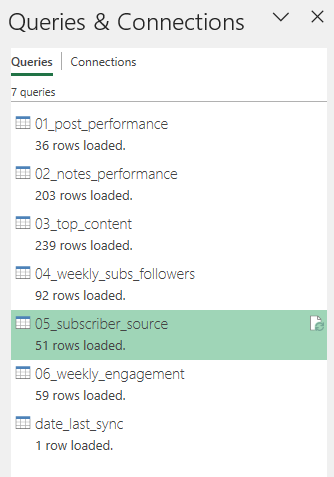
This queries and connections view is really useful on its own - by right clicking on any item, you have a number of actions you can perform - making Excel a suitable place to explore the data without something like DBeaver as an exploratory tool.
Step 5: Use the data to monitor progress and build a feedback loop
We use this Excel file to focus our discussions when we meet to develop a content calendar, refine our messaging, and decide what we want to test next - whether that’s new topics, formats, or ways of engaging.
While we sync our data weekly, we don’t review every metric on that cadence. Instead, we use the data when it’s most useful. Sometimes that’s weekly, sometimes monthly or higher when patterns take longer to emerge.
What matters is the data feedback loop:
We look at what we did
We look at how it performed
We decide what to adjust
Then we repeat.
Having the data at this level of detail makes that possible. We can go back and isolate the impact of a specific post or outreach effort, compare across time, and test whether changes in what we write or how we share it actually make a difference.
When volumes are small, we aggregate to monthly or even quarterly views to get a clearer signal. Over time, this helps us move from reacting to individual results to recognizing patterns, and using those patterns to guide what we do next.
Step 6: Explore the data using AI
Earlier we described some pros and cons we experienced working with Claude. How you use AI will depend on your objectives, but the real value shows up once you understand your data well enough to ask better questions.
Here are a few ways we’ve used AI to extend beyond hands-on analysis:
Content strategy analysis
AI can help you step back and look at your content more systematically:
Topic and theme analysis
Have the AI classify your posts and notes into topics, then compare performance across those themes. Review and refine the categories - s a starting point, not a finished taxonomy.Format and channel performance
Look at how format (short vs. long, structured vs. narrative) and channel (posts vs. notes) influence engagement. Different types of content often perform differently in each format.Timing and mix
Identify periods of stronger performance and examine what you were publishing at the time - topics, formats, and frequency.
The goal here isn’t just to find “what works,” but to understand why it works and where you might want to experiment next.
Audience and subscriber analysis
AI is also useful for understanding how your audience is behaving over time:
Engagement patterns
Identify which subscribers are consistently active vs. going quiet, and track how engagement changes over time.Growth and re-engagement signals
Look for moments where activity spikes. Did a particular post or note correlate with new subscribers? Who might need re-engagement?
Perfect attribution is less important than spotting directional signals you can act on.
Tips for getting the best out of an AI for analyzing data
Tell the AI what you already know about your data. As we saw when we experimented with Claude immediately after setting up the StackContacts integration - Claude will make reasonable assumptions, but we need to know the quirks of our own data. Surface those to the AI early and the analysis will immediately get sharper. That can include things like:
How key fields are defined (e.g., free vs. paid subscribers)
Which fields or tables to trust or ignore
How you define engagement or success
Any transformations you’re applying (e.g., weekly/monthly aggregation)
The specific question you’re trying to answer
Ask the AI to check the data structure before analyzing it. Asking the AI to look at the columns and a sample of rows first. A prompt like “before you analyze, show me what’s in this table and confirm what each key column means” saves a lot of back-and-forth.
Be specific about what question you’re trying to answer. “Analyze my notes” is not a useful prompt for an AI. Questions such as “Which note topics get the most reactions, and does a short vs. long format change that?” provides a clear target.
Correct the AI when something doesn’t look right. For example, an initial topic analysis of notes was off because the AI was mixing original notes with replies and restacks. Flagging that immediately led to a much more accurate analysis.
We were learning while we were building, and we continue to refine our queries and our analysis. We’ve tried to capture our steps - and our missteps - here. If you have tips and ideas on how to do it differently, or if something isn’t clear, we would love to hear from you. Please comment or send us a message. We reply to them all.
Wow...this article is a fantastic "missing manual" for StackContacts product.
Thank you for sharing the details on how you extract the insights from your Substack publication data.
There are so many great tips and concrete examples of how to explore the data, build the missing data dictionary, create queries to track the metrics you care about.
I am using DBeaver as well, but often use just the command line duckdb interface to make quick SQL queries to verify some details. I'm using Google Sheets and there is a DuckDB community extension https://duckdb.org/2025/02/26/google-sheets-community-extension that allow to automate like you've shown here with Excel and ODBC interface.
Claude AI is pretty smart discovering the database structure and the fields, but it makes mistakes so providing better context helps a lot. I've used Cursor with .claude/commands folder where I store prompts that have exact SQL queries and instructions for more complex analysis - such as attribution for Gumroad sales (which content led to purchase). I'm developing these prompts iteratively (just like in your examples), troubleshooting outputs and cross-checking with other sources when the results don't look correct.
Great article!!!